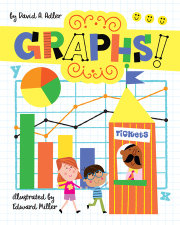
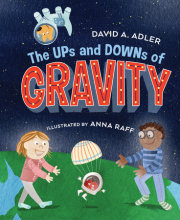
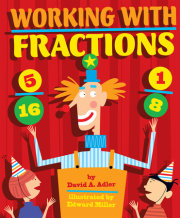
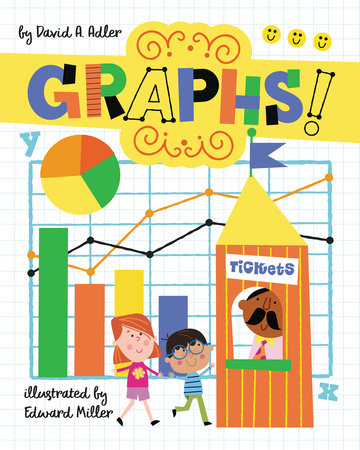
Math booster author David A. Adler and artist Ed Miller make pie charts easy-as-pie charts with this fun and vibrantly illustrated guide to data collection.
For students, STEM topics don't always feel like a walk in the park. But what if they were more like a day at the fair? Follow Janet and Ben from the Ferris Wheel to the carousel as they use graphs and data collection to make decisions about their day. This is the sixteenth book in this duo's math picture book series.
Combining elements of a graphic story with engaging and accessible nonfiction text, David A. Adler combines his well-established STEM know-how with Edward Miller's vibrant, high contrast art to take young readers on a wild ride through the world of bar graphs, pictographs, pie charts, and more!
SELECTION
| 2024 Booklist Editor's Choice
★ "The diverse cast of characters, relatable scenarios, and straightforward presentation make this a worthwhile STEAM addition for public and school library collections."—Booklist, Starred Review
"Charts helpful ways to visualize and express numerical data."—Kirkus Reviews
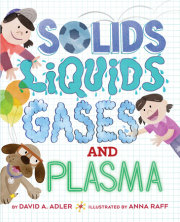
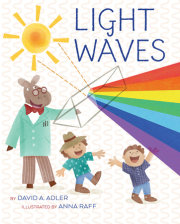
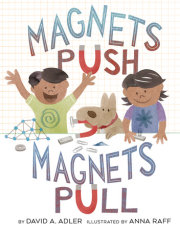
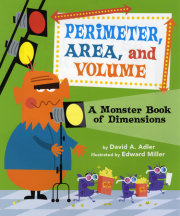
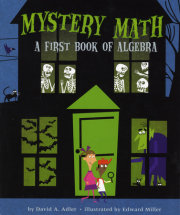
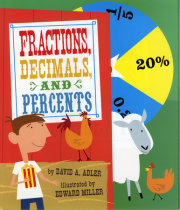
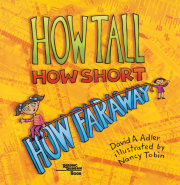
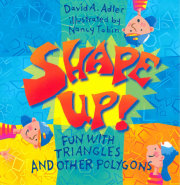
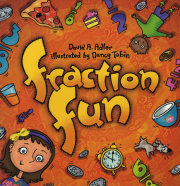
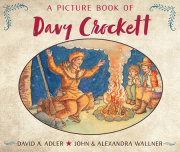
David A. Adler is a former math teacher and author of more than two hundred books for children. He has collaborated on several science picture books with Anna Raff, including Light Waves and Magnets Push, Magnets Pull, both named finalists for the AAAS/Subaru SB&F Prize for Excellence in Science Books. He is also the author of the Picture Book Biography series and the Cam Jansen mystery series. He lives in New York.
Edward Miller is a former children's book art director who loves to make concepts clear to kids and has demonstrated that in his previous nonfiction books. School Library Journal praised his Alphabeep: A Zipping, Zooming ABC by Debora Pearson as "stunningly illustrated." He illustrates a variety of products for kids in addition to books. He lives in Beacon, New York. Follow him on Instagram @edelementary.
Math booster author David A. Adler and artist Ed Miller make pie charts easy-as-pie charts with this fun and vibrantly illustrated guide to data collection.
For students, STEM topics don't always feel like a walk in the park. But what if they were more like a day at the fair? Follow Janet and Ben from the Ferris Wheel to the carousel as they use graphs and data collection to make decisions about their day. This is the sixteenth book in this duo's math picture book series.
Combining elements of a graphic story with engaging and accessible nonfiction text, David A. Adler combines his well-established STEM know-how with Edward Miller's vibrant, high contrast art to take young readers on a wild ride through the world of bar graphs, pictographs, pie charts, and more!
Awards
SELECTION
| 2024 Booklist Editor's Choice
Praise
★ "The diverse cast of characters, relatable scenarios, and straightforward presentation make this a worthwhile STEAM addition for public and school library collections."—Booklist, Starred Review
"Charts helpful ways to visualize and express numerical data."—Kirkus Reviews
Author
David A. Adler is a former math teacher and author of more than two hundred books for children. He has collaborated on several science picture books with Anna Raff, including Light Waves and Magnets Push, Magnets Pull, both named finalists for the AAAS/Subaru SB&F Prize for Excellence in Science Books. He is also the author of the Picture Book Biography series and the Cam Jansen mystery series. He lives in New York.
Edward Miller is a former children's book art director who loves to make concepts clear to kids and has demonstrated that in his previous nonfiction books. School Library Journal praised his Alphabeep: A Zipping, Zooming ABC by Debora Pearson as "stunningly illustrated." He illustrates a variety of products for kids in addition to books. He lives in Beacon, New York. Follow him on Instagram @edelementary.